Local species richness may be declining after all

Recently two papers seemed to turn what we thought we knew about changes in biodiversity on their head. These papers by Vellend et al. and Dornelas et al. collated data from multiple sources and suggested that species richness at local scales is not currently declining. This was counter-intuitive because we all know that species are going extinct at unprecedented rates. However, it is possible that the introduction of non-native species and recovery of previously cultivated areas may offset extinctions leading to relatively little net change in local species richness.

This week a paper has been published that calls these findings into question. The paper by Andy Gonzalez and colleagues published in the journal Ecology, suggests that there are three major flaws with the analyses. These flaws mean that the answer to the question ‘Is local-scale species richness declining?’ currently remains unanswered and is unanswerable.

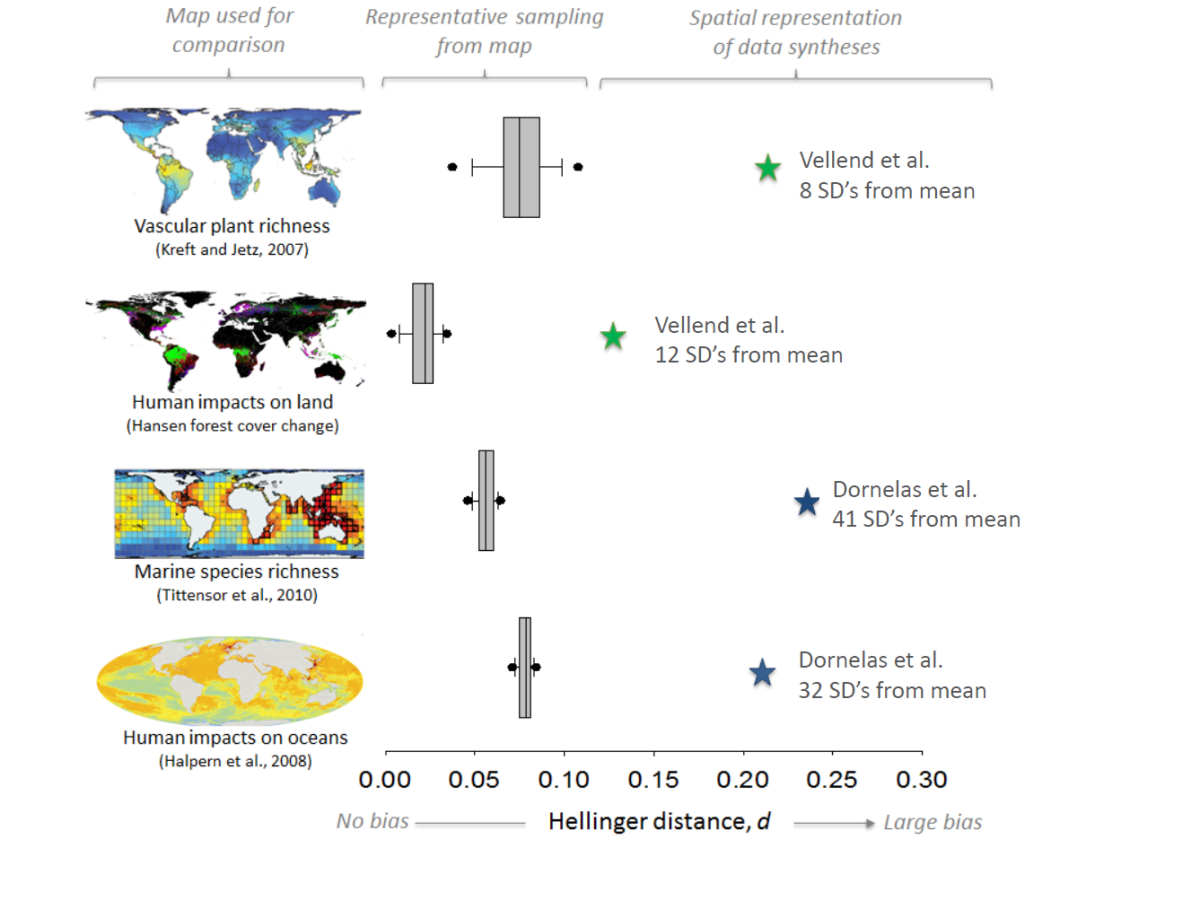
The papers of Vellend et al. and Dornelas et al. were meta-analyses of previously published papers. One issue with meta-analysis is that it is very prone to bias. Like any study if the samples (in this case ecological studies) are not representative of the population (in this case locations around the globe) then any results will be flawed. To test the representativeness of the datasets used by Vellend and Dornelas Gonzalez et al. examined how well they represented biodiversity and threats to biodiversity. This analysis (see below) showed that the papers were not representative of biodiversity or the threats faced by biodiversity (though curiously, the analysis of Dornelas et al. showed an overrepresentation of areas highly impacted by human impacts).

Gonzalez_1.png
Figure 1 – Spatial bias of the Vellend et al. (2013) and Dornelas et al. (2014) data syntheses. For more information see the paper by Gonzalez et al. (2016).

The paper also suggests that using short time series can underestimate losses. By analysing the effect of study duration and changes in species richness (see below) Gonzalez et al. claim that increases in study duration were correlated with a decline in species richness. This supports previous theory which suggests that there is often a time lag between disturbance events and species extinctions – termed ‘extinction debt.’ However, I’d be intrigued to see the results of removing the studies with the longest duration from this analysis since the authors admit that the analysis is sensitive to their inclusion. I’ve seen recent similar work that suggests the same kind of relationship might be seen for studies monitoring individual animal populations.

Gonzalez_2
Figure 2 – The effect of study duration on apparent changes in species richness.

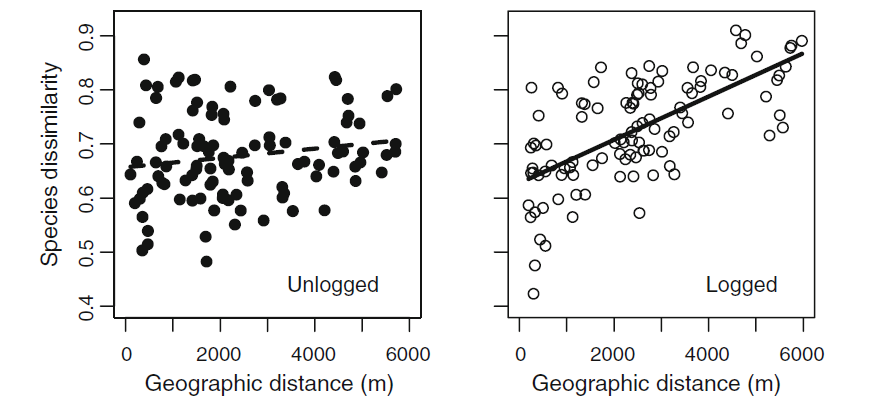
Thirdly, Gonzalez et al. assert that including studies in which ecosystems were recovering from disturbance (e.g. regrowth on former agricultural fields) without taking into account historical losses that occurred during or after the disturbance biases estimates of change. The paper by Vellend et al. in particular combined studies of the immediate response of biodiversity to disturbances such as fire and grazing along with studies of recovery from the very same disturbances. Gonzalez et al. show that once studies of systems that were recovering are removed from Vellend et al’s analysis there is a negative trend in species richness changes.

The biases prevalent in the Vellend and Dornelas papers lead to Gonzalez et al. to suggest that the papers cannot conclude what the net changes in local species richness are at a global scale. However, they note that the results of Dornelas and Vellend are in sharp contrast to other syntheses of biodiversity changes which used reference undisturbed such as those by Newbold et al. and Murphy and Romanuk which reported average losses of species richness of 14 and 18% respectively.

In their conclusion Gonzalez et al. suggest that though meta-analysis is a powerful tool, it needs to be used with great care. Or to put it another way, with great power comes great responsibility. As someone who regularly uses meta-analysis to form generalisations about how nature works I completely agree with this statement. Traditionally scientists have used funnel plots (graphs with study sample size on the y-axis and effect size on the x-axis) to identify biases in their analyses. I’ve always been skeptical of this approach, especially in ecology where there is always a large amount of variation between sites. In the future syntheses would do well to follow the advice of Gonzalez et al. and really interrogate the data they are using to find any taxonomic, geographic, climatic or any other biases that might limit their ability to generalise. I know it’s something I’ll be taking more seriously in the future.

Gonzalez et al. also point out that most ecological research is carried out in Europe and North America. If we want to monitor biodivesity we need to increase efforts in biodiverse tropical regions, as well as boreal forests, tundra and deserts. We need to identify where these gaps need filling most and then relevant organisations need to prioritise efforts to carry out monitoring. I am positive that this can be achieved, but it will cost a lot money, needs to be highlighted as a priority and will ned a lot of political good will. Even with this effort some of the gaps in biodiverse regions, such as the Democratic Republic of Congo, will be extremely difficult to fill due to ongoing armed conflict

My take-home message from this paper is that we need to be more careful about how we do synthesis. However, I also think that species richness isn’t the only metric that we should focus on when talking about biodiversity change. Studies have shown that measures of the traits of species present in a community are generally more useful for predicting changes in ecosystem function than just using species richness. Species richness is the iconic measure of biodiversity, but it probably isn’t the best. Ecologists should view species richness in the same way as doctors view a thermometer – it’s a useful tool but you still need to be able to monitor blood pressure, take biopsies and listen to a patient’s lungs before you diagnose them*.


*Thanks to Falko Bushke whose analogy I stole from a comment he made on my blog post here.


Beta-diversity – What is it good for?

A while ago I wrote a post asking whether everyone’s favourite measure of biodiversity, species richness, was useful. In it, I concluded that it is probably one of the bluntest, least informative measures of ecological communities we have and that we should try to use alternative metrics when possible. Recently, I started wondering about what other measures of biodiversity might be informative, and what they can be used for. And then a neat review of beta-diversity by James Jacob Socolar ( correction courtesy of James Gilroy on Twitter – thanks James!) and colleagues came out in Trends in Ecology and Evolution, so today I’ll focus on that, borrowing from some of their thoughts and hopefully adding some of my own along the way. In the future, at some point, I’ll write something about temporal changes in ecological communities at individual sites.

So, firstly what do I mean by beta-diversity? Beta-diversity broadly reflects the differences in community composition between sites.  Gamma diversity (regional diversity) is a product of both beta- and alpha-diversity (diversity at a single site). And there are lots* of different ways of measuring beta-diversity. The simplest metric for beta-diversity is termed ‘true beta-diversity’ and was defined by Whittaker in 1960 as:

\beta=\frac\gamma\alpha

This metric is perhaps the easiest to interpret, but it also needs a reliable estimate of gamma diversity, so may be difficult to use in practice. Using this method allows the relationship between alpha and gamma diversity to be investigated. Other measures can be based on dissimilarity matrices, identifying pairwise differences between sites. These metrics can then be used to look at drivers of these differences, such as the geographic distance between individual sites and environmental differences. However, dissimilarity matrix methods don’t allow the relationship between alpha and gamma diversity to be investigated. The above explanation probably explains the ubiquity of species richness as a metric in ecology – we can all (more-or-less) agree on what it means.

Changes in beta-diversity when humans alter natural landscapes can be unpredictable. When human disturbances are patchy, such as in the case of selective logging, beta diversity has been shown to be stable or increase due to an influx of generalist species in forest gaps.

berry_et_al
Differences changes in tree community dissimilarity with increasing distance between sites in unlogged and logged forest. Note that logged forests show a more rapid rate of change, suggesting that logging results in more variable ecological communities. Figure modified from Berry et al 2008.

In contrast, when human land-use change results in the conversion of natural ecosystems to a relatively homogeneous system in which only a small subset of species can survive, beta-diversity tends to decrease. Examples of such drivers include agricultural conversion and urbanisation. However, even high intensity farming can result in an increase in beta-diversity particularly if species populations decrease leading to greater dissimilarity purely as a result of random processes.  In summary, the response of beta-diversity to anthropogenic change appears to be relatively idiosyncratic.

All of this is well and good, but what use is beta-diversity to practical conservation? At first inspection, this is not clear. The general perception of species richness is that more species = better**. Does higher beta-diversity = better? Well, no, not necessarily. Given that the aims of conservation vary from place to place, it is not surprising that how beta-diversity can be used also varies.

The most obvious use of beta-diversity is in spatial planning of protected areas. In landscapes which show a high spatial turnover of species, managers might favour the use numerous distinct reserves to capture this variation. However, in a landscape in which beta-diversity results from differents in species richness a single protected area might be favoured. Also, if a natural ecosystem is particularly distinct from other candidate sites it may be considered a priority for protection.

High beta-diversity can also result from dispersal limitation in a landscape. For example, secondary forests in fragmented landscapes plants with seeds dispersed by wind may colonise sites more readily than those dispersed by animals that may not cross non-forest areas. So in cases where beta-diversity amongst patches of a similar habitat in a fragmented landscape is high, this may point to the need for restoration to increase connectivity. Successful restoration may result in a decrease of beta-diversity as dispersal between patches increases. For example, Renata Pardini’s work has shown that the small mammal communities of more highly connected fragments of Atlantic forest are more similar to other patches than unconnected fragments. However, as far as I know, there is relatively little evidence empirical that restoration has similar effects.

In the paper I mentioned earlier, Jacob Socolar and colleagues suggest that beta-diversity may also be useful in informing the land-sharing vs land-sparing debate (which i have previously written about here, here an here). They argue that the use of beta-diversity as part of this debate may show that heterogenous landscapes that include agri-environment schemes, management of natural systems and high intensity agriculture are better at maintaining alpha- beta and gamma-diversity. Thus, the incorporation of metrics other than population sizes of species, the classic approach for such comparisons, may produce different conclusions to current studies, which largely suggest land-sparing as a favoured approach. As always with conservation, this depends on what you think we should try to protect. Should we focus on particular species? Or should we look attempt to conserve the processes that maintain coarse-scale diversity?

For me, the key point that the paper makes is that even though two recent high-profie studies recently suggested local-scale alpha-diversity is relatively constant***, global scale gamma-diversity is declining. This suggests that rare species are getting rarer and common species are increasing in abundance. If we can work out how and why beta-diversity responds to land-use changes we can better understand how to conserve gamma-diversity. However, before we do that we need to develop methods to upscale from alpha to gamma diversity and determine how different disturbances alter beta-diversity. Novel approaches offer the potential to solve this problem, but substantial testing is needed to determine how useful they are.


*Patricia Koleff identified 24 metrics for use with presence-absence data and my  old CEH office mate Louise Barwell tested 29 different beta-diversity metrics that incorporated abundance data. Give both of these papers a read, they’re well worth your time.

**I don’t agree with this perception, I’m just extrapolating based on things I have heard from a few people. Deeply unscientific, I know.

***I saw Andrew Gonzalez present some work on the problems of these two studies at the 2015 British Ecological Society annual meeting and hope to post something when the paper comes out. I can’t say much, but it was fascinating stuff.


Land-sparing/sharing in tropical logged forests

The dichotomy between land-sharing and land-sparing has been used a lot in studies on the impacts of agriculture on biodiversity to compare between relatively intense, highly productive agriculture that spares natural ecosystems from conversion and extensive, wildlife friendly agriculture with lower yields. The comparison between these two extreme ends of the land-use spectrum could potentially be applied to a whole host of problems relating to how we use land, such as urban planning, electricity production and timber production. While making changes to a manuscript I have been pondering the last of these problems a bit, in the context of tropical selective logging.

Our recent preprint, as well as in 2 other papers in the last year (here and here), showed how the impact of logging biodiversity and carbon storage vary over a gradient of logging intensity. Where large volumes of wood are extracted species richness of trees and animals are negatively impacted, animal populations are reduced as is carbon storage in tree biomass. This gradient of logging extraction represents potential different intensities at which tropical forests could be logged, extensive and low intensity, or high intensity and spatially concentrated. Though it is a topical subject (indeed there has been an NCEAS working group set up to deal with it and who have a flashy website here) there has been little empirical study of land-sparing/sharing in the context of tropical forests, with the only study published so far suggesting that land-sparing presents a better option for birds, dung beetles and ants in Borneo. Typically the gradient of timber extraction is calculated as the volume of trees felled per hectare. However, there are a number of problems that make this metric far from ideal.

Firstly, it tends to be calculated at very large scales, often covering an entire forest concession of hundreds of hectares. To get a better idea of the impact of logging across a gradient the scale of the measurement needs to be reduced so that variation between plots can be examined. Also, though the volume of trees felled obviously tells us quite a lot about the gradient of disturbance, it doesn’t actually tell us what we want to know – the yield. Just as crop yields are what is most important for a farmer the yield of timber from a logging concession is the primary concern of logging companies. Importantly the volume of trees harvested is not always very good at measuring this, since some logging operations are more efficient than others. For example, some trees that are felled but never actually make it to the sawmill. Such wastage is more likely in unplanned logging when lack of co-ordination can result in logs being left behind after being cut, and as a result the yields per hectare can be lower than measures of logging intensity might otherwise suggest.

Though there is currently some discussion of whether sharing or sparing are likely to result in better outcomes in tropical logged forests, the truth is that we currently don’t know much since we lack the sufficient evidence. In order to get this much needed evidence we need to make sure that when studies are designed to answer the land sparing/sharing question in tropical forests they use timber yield, not logging intensity as their gradient and species density as their response variable. Doing this will require closer collaboration with logging companies in order to get detailed information. Some people have cited the fact that logging appears to have relatively little effect on species richness at low intensities, however as I have discussed these relatively modest reductions in species richness may mask large changes in what species are present. As such species richness has no place in the debate about the configuration of landscapes in the context of tropical logging.

In addition to the populations of priority conservation species any future assessment of land-sharing/sparing must recognise that recovery times for carbon and timber tree populations are likely to be longer when logging intensities are high. Given this it seems likely that in order to reach as many goals as possible logging intensity should be high enough to reduce the area impacted but low enough to allow recovery within cutting periods – often around 30 years. Finding this balance will be difficult in the current data vacuum.

Species richness – what is it good for?

Species richness is the iconic measure of biodiversity. It is simple to interpret* and it is one of the most commonly measured metrics in ecology. From the early beginnings of ecology Darwin, Wallace and von Humbolt noted the striking differences in the number of species found in different places and ecologists are still fascinated by it . However, over the last few months I have begun to question how useful it is for applied research.
Continue reading

Forest regeneration provides cheap carbon and biodiversity benefits

First of all, hello again and apologies for my sporadic posting on here recently. I have now successfully defended my viva and have a few corrections to make but hopefully should be able to post on here a bit more regularly from now on.

One paper I read that really impressed me while on my hiatus from the blog was by my old commuting buddy James Gilroy and colleagues. This paper attempted to identify the potential biodiversity and carbon benefits of forest recovering in the Tropical Andes in Colombia, an area full of species found nowhere else many of which are under threat from agricultural conversion. The paper also attempted to look at the cost effectiveness of carbon payments for landowners who converted farmland to forest when compared to different land-use options like cattle farming.

Gilroy et al - Fig 1
Recovery of secondary forest carbon stock compared to that of pasture and primary forest (Taken from Gilroy et al. 2014)

I was actually quite surprised by what Gilroy and his team found. Their results suggested that carbon storage in recovering forests was fairly similar to that in mature forests in the area after around 30 years, much less than the 100 years or so that I estimated these stocks would take to recover in a previous study.

Gilroy et al - Fig 4

Gilroy et al - Fig 3
Relationships between carbon stocks and similarity of dung beetle and bird communities to primary forest communities (Taken from Gilroy et al. 2014)


More surprising still was that bird and dung beetle communities in the regenerating forests were fairly similar to those of mature forests, suggesting that they have high conservation value. Again previous studies have generally estimated that animal species that are forest specialists may take a long time to colonise secondary forests, and plants probably take even longer. The fast recovery times may be attributable to the relative closeness of recovering forest to intact forests in the study area, allowing immigration of  forest animals and increased likelihood of transportation of seeds from long lived tree species.

Gilroy et al - Fig 2
Relationship between the additional cost of undertaking forest regeneration and the price paid for carbon per tonne. The solid horizontal line shows where costs are equal to zero. This graph indicates that there are potentially net economic benefits for people undertaking forest regeneration projects when the carbon price is greater than $4 per tonne. (Taken from Gilroy et al. 2014)

More important than these findings though was the discovery that if forest regeneration schemes were implemented in the area, they could be more profitable to land-owners than current land-uses like cattle farming. This was true for all pastures in the area when carbon trading prices were greater than $4 per tonne of CO2 and given that the median price of carbon in 2013 was around $7.80 per tonne, paying for the carbon benefits of regeneration in these locations works out cheaply. This is the part that I thought was really neat, because all too often restoration schemes fail to account for the costs and benefits associated with such projects.

Given that the study area has fairly representative socioeconomic conditions to those found in the wider Colombian Andes, the results suggest that regeneration of cloud forest may provide a great opportunity for REDD+ carbon based conservation, which can deliver multiple environmental benefits at minimal cost. Though REDD+ has its critics it has the potential to transform forest conservation so we need to work hard to make sure it is done in the right way.

Looking to the past for insights into tropical forest resilience

A few weeks back Lydia Cole and colleagues published a really cool paper exploring recovery rates of tropical forests. Seeing as it’s something I’ve covered a here before in relation to my work on secondary forests recovering after agricultural clearance and recovery from selective logging, I invited Lydia to write a guest post giving a different perspective to a topic I have discussed here before. Thanks to Lydia for stepping up to the plate and I hope you find her post as interesting as I did.


Anyone reading this blog probably doesn’t need reminding of how important tropical forests are!  Birds, bees, berries and a whole load of other plants, animals and services that we probably underestimate our reliance on.  Despite the many arguments in favour of keeping tropical forests standing, vast areas continue to be deforested at rapid rates resulting in changes like that shown below (Fig 1), under pressures of expanding human population, rising consumption and the agricultural footprint to match (Geist & Lambin, 2002).

Borneo-forest
Fig 1 – Forest disturbance like logging can lead to forests such as this one in Borneo being converted from intact (left) to heavily degraded (right).

Disturbance and recovery in tropical forests Despite this widespread clearance as a result of  recent international forest conservation initiatives and rising rural-to-urban migration (Mather, 1992), some degraded tropical forests are being given a chance to recover.  But how long does it take them to recover?  Much recent research has attempted to answer this question (e.g. the great work of Chazdon et al., 2007) but little has monitored change over time scales of >50 years. Since many tropical trees have lifespans much longer than this previous studies have only captured a snap-shot of the ecological process of recovery.  In our study, we attempted to answer the question again; this time by looking into the past to gather data over longer time scales that could offer a more complete picture of forest recovery post disturbance.

The palaeoecological approach

Palaeoecology, otherwise known as long-term ecology, uses fossils to decipher how plants and animals interacted with their environment in the past.  Fossil pollen grains come in all shapes and sizes, and their morphological characteristics can be used to identify the plant family, genus or even the species to which they belong.  When a collection of these grains are identified and counted from a layer of sediment, we can reconstruct what the vegetation was like at that point in time when those grains were deposited. In our project, we were interested in studies that documented disturbance-induced changes in fossil pollen from forested communities across the Tropics, over the last 20,000 years.  Types of disturbances ranged from climatic drying events and landslides, to shifting cultivation and human-induced biomass burning.  We found 71 studies published on tropical forest palaeoecology that satisfied our selection criteria (e.g. within 23oN/S of the equator, possessing a sufficient chronology), documenting 283 disturbance and associated recovery events.  The rate at which recovery was occurring across the different forests and disturbance events was the key variable of interest and was calculated as the percentage increase in forest pollen abundance per year relative to the pre-disturbance level.

How far and how fast have tropical forests recovered in the past?

Our results demonstrate that in the past the majority of forests regrew to less than 100% of pre-disturbance levels, prior to declining again or reaching a new baseline; the median recovery was to 95.5%.  They also recovered at a variety of speeds, ranging from rates that would lead to 95.5% regrowth in less than 10 years to those taking nearly 7,000 years; the average was 503 years.  This is significantly longer than the periods adopted by logging companies between extraction cycles!

What affects the rate of recovery?

Three of the different factors we investigated for their potential effect on the forest recovery rate seemed to be of particular importance: geographical location, disturbance type and frequency of disturbance events. Of the four key tropical regions, Central American forests recovered the fastest and those in Asia the slowest (Figs. 2 & 3).  This is concerning, given that forests in Southeast Asia are currently experiencing some of the greatest rates of deforestation of all tropical regions, primarily due to the economic profitability of oil palm agriculture (check out mongabay for details).

Tropical forest recovery
Fig. 2  Map of tropical forest distribution, the location of studies and relative recovery rates across regions.

The most common form of disturbance, and one from which forest regrowth happened relatively slowly, was anthropogenic impact, i.e. via logging, burning and/or for agriculture (Fig. 3).  The slowest rates of recovery occurred after climatic disturbances and the fastest after large infrequent events, e.g. landslides, hurricanes and natural fire.  This latter result is somewhat intuitive given that these perturbations are a natural part of all ecosystems, leading to the evolution of a dynamic response in the native plant communities.  

Figure 3
Fig. 3  Composite figure showing how the recovery rate varies with different variables.

Insights into resilience

When we looked at the standardised rate of disturbance events (SRD), i.e. the number of disturbance events per 1,000 years, we found that the greater the frequency events occurred in the past, the more quickly the forest responded to each subsequent disturbance.  This runs counter to contemporary theories on resilience that describe slowing rates and diminishing ability to recover with each subsequent perturbation (e.g. Veraart et al., 2012).  Our results suggest that over ecologically meaningful timescales, i.e. over the life-span of entire forest communities rather than single trees, increased exposure results in adaptation to that disturbance over time, leading to a greater ability to recover quickly from the perturbation.

What does this all mean for tropical forests?

From looking back into the past, it seems that tropical forests can take a long time to recover from disturbances, and that different regions may require different management regimes to encourage more complete reforestation after natural or anthropogenic events, such as fire.  Central American and African forests may bounce back from impacts more quickly than the other regions, with disturbances such as tropical hurricanes and climatic fluctuations being a more common component of these ecosystems than in the other tropical regions.  However, all of the forests we looked at demonstrated a greater vulnerability to anthropogenic impacts and climatic changes than large infrequent disturbances: the two major forms of disturbance occurring today and at levels that far exceed those experienced over the past 20,000 years – reasons for caution.

Sustainable management

Identifying and understanding the different ecological requirements of forests across the different geographical regions, and of the forest-types within those regions, is vital for developing more sustainable landscape management plans.  With increasing international concern over deforestation rates, the associated loss of biodiversity and elevated carbon dioxide emissions, the conservation and restoration of tropical forests is becoming more politically and economically feasible.  Indonesia, for example, has introduced ‘ecosystem restoration concessions’ in the last decade, providing a legal means for forest protection from the further expansion of industrial agriculture.  And the potential of Reducing Emissions from Deforestation and Forest Degradation (now REDD+) to save the World’s forests continues to generate international debate. Of importance to all of these programmes and initiatives, is the suggestion from our study that forests take time to recover, and if we give them that time, they will persist, and continue to provide their faunal inhabitants, including us, the greatest collection of biological riches on Earth.

Knowledge gaps for urban land sharing & sparing

Photo courtesy of villes on flickr.

If you are reading this there is a good chance that you live in a city.

You’re not alone. About half of all humans now live in cities.

These cities will continue to grow for the next century and the rise of the megacity with more than 10 million souls will continue apace.

Because of this we need to think seriously about how we plan our cities so they can fulfil our needs as well as possible. They should be easy to get around, they should be a pleasant place to live and they should be as nature friendly as we can make them.

When you talk about cities and nature people often give you odd looks. “But surely all the nature is out there, in fields,” they say. They have a point. But when it comes to direct experience of nature most of us do that in cities.

Regular readers will know I have form in this area and this week a really interesting paper came out in the journal of Applied Ecology looking at the potential for using the land-sharing/land-sparing idea for urban planning.

I have to be honest that the initial thought when I saw this paper was “someone’s robbed the idea from my blog post!” After I calmed down and actually read the paper I realised that the authors had thought about it all a hell of a lot more than I had. I could hardly accuse them of stealing my ideas – after all there are a finite number of subjects out there, much like the material for jokes. With enough monkeys and enough typewriters and all that…

Anyway, the paper points out the similarities between the design of landscapes for agricultural production and urban areas, summarised below.

Sparing vs sharing urbanPanels (a) and (c) are the extreme ends of the land sparing continuum for agriculture and urban planning. Panels (b) and (d) are the land sharing ends of this spectrum.

The paper then discusses what we know about urban design in the context of the land sharing/land sparing debate. The answer is (spoiler alert!) not much.

To fix this the authors suggest 4 key areas we need more work on:

  • Understand how biodiversity reacts to urban intensification, particularly at the lower end of the scale.
  • Investigate how the shape and arrangement of fragments of habitat influences extinction risks.
  • Understand which urban ecosystems and designs are best for conserving populations and ecosystem services.
  • Undertake whole city analyses to compare between different city layouts and determine their ecological impact.

We live in an ever more crowded world, where people are shifting towards cities so we need to think about this stuff.  Go and read the paper.


Experiments in fragmentation

Sites used by Biological Dynamics of Forest Fragments Project in Brazil

This is not really a proper post. It’s just here to highlight the great news article by Nature on experiments in tropical forest fragmentation. It backs up what I was saying in my article on the effects of logging on tropical biodiversity and talks a bit more about what the SAFE project is doing in Borneo in testing the effects of oil palm plantations and logging on forest structure and biodiversity. We need more of this kind of work and I’m really interested to see the first results from SAFE.

How bad is logging for tropical biodiversity?

How bad is logging like this for biodiversity?
(Image by flickr user Wakx)

Logging of tropical forests effects an area 10 times greater than the area converted to agriculture each year. Around 400 million hectares of tropical forest have been set aside for permanent logging – an area twice the size of Russia. Or one hundred and ninety two and a half times the size of Wales – if that’s your thing*.

Shocking, right?

But just how bad is this logging?

For starters it obviously not as bad as agricultural conversion. When land is cleared for farming all trees are removed. However,  logging is generally selective – only trees that are valuable for timber are removed, though many others can be damaged in the process. These differences between logging and agricultural conversion change the structure  of ecosystems in different ways and thus effect the species that are present in them differently.

Forest converted for agriculture  is largely dominated by generalist species. Logged forest on the other hand retains some of the conservation value of undisturbed forests. However, answering just how bad logging actually is for tropical forest biodiversity is tricky.

In the biggest study of its kind Gibson et al (2011) found that logging was the least harmful of the human impacts they investigated on tropical forest biodiversity. However, this meta-analysis brought together lots of different measures of biodiversity including, population sizes, species richness, demographics and community structure and used them to come up with a single metric. Whilst this serves to give an overall understanding of ‘forest health’ following different human disturbances, it tells us little about the general changes in particular features of biodiversity.

Effect of different disturbances on tropical forest biodiversity. Boxes represent median +/- 95% confidence intervals. Taken from Gibson et al 2011

The simplest measure of biodiversity is species richness. On the whole logged forests seem to have pretty similar richness to neighbouring undisturbed forests for most taxonomic groups.  Richness is not a very useful metric though. It tells us nothing about what the species are that you find in logged forests. On one hand they could all be generalist species which are not endangered. On the other they could all be endangered species. By looking at species richness alone we have no idea about these details.

This is key to working out the conservation value of this forest since conservationists usually want to protect the rarest species to stop them from going extinct. So, how good is logged forest for these species? And do the communities resemble those of unlogged forest?

The truth is we’re not sure. Some work has suggested there is little difference in the communities and numbers of endangered species, while others suggest differently. Whatever the reality a new piece of work has found that >60% of studies on the effect of logging on community composition are flawed. The paper in Conservation Biology looked at the design of studies of logging done between 2000 and 2012 and found nearly all of them had designs that meant they couldn’t differentiate the effects of logging from the potential differences in the forests even before logging. This apparently was all down to (the dreaded) pseudoreplication.

To have a properly replicated design you need the logged and unlogged sites to be scattered throughout the landscape. However, most study sites were sampled so that all the logged sites fell in one area and all the unlogged sites in another area. This means that simply because samples are close to each other they are more likely to be similar to their respective group. In tropical forests this is a problem because species composition can change over relatively short distances.

An idealised sampling design of a study looking at community composition change in logged forests
Sampling designs of a hypothetical pseudoreplicated study and an idealised well replicated study investigating community change in logged forests

In addition few studies sampled more than one area of unlogged forest to test similarity between unlogged forest communities. The authors of the article suggest a possible way to get around this problem for some studies is to determine the relationship between plot similarity and distances between them. However, this option is second best. Properly replicated studies would give us a better idea of the effect of logging on tropical forest species.

Given how large an area has been logged, and will be logged in the near future we need to work out what’s going on with these forests. Many logging companies are open to reducing biodiversity loss so they can qualify for certification such as FSC, allowing timber to be sold at a premium price. We need partnerships with these companies, like has been done with the SAFE project and oil palm companies in Malaysia. Only by doing this will we be able to produce experimentally robust designs that allow us to draw proper conclusions about the future of tropical forest species in logged forests.

*If any US citizens want this calculating as relative to Rhode island, I did it. It’s 1273.8 Rhode islands.

What traits drive response of birds to tropical land-use change?

Could fruit eating species such as the black-mandibled Toucan be disproportionately affected by land-use change?
Could fruit eating species like the black-mandibled Toucan be disproportionately affected by land-use change? (Photo credit to Ettore Bacocchi on flickr)

Everyone pretty much knows about the crisis of biodiversity loss facing the tropics.

In case you missed it tropical forests are being rapidly cleared, which human population increases and along with consumption. All this has lead to large losses of biodiversity in the tropics.

So far, so boring.

However, up until recently we didn’t have much of an idea how the characteristics of species in the tropics influenced their response to land-use change.

‘Why would we want to know that?’ – I hear you ask. Well if you’ve seen my blog before you will know that traits are  a good way of linking biodiversity change to changes in ecosystem function and services. This is the first step to working out the consequences of the massive changes in biodiversity we have seen over the last century. Simply put – we need to know this stuff.

Given what I think, it was great to find out at the recent BES 2012 annual meeting in Birmingham about a paper looking at how bird species with different traits respond to land-use change in the tropics.

Tim Newbold, a postdoc at the World Conservation Monitoring Centre in Cambridge, and colleagues compiled an impressive dataset of  >4500 records of >1300 bird species from 23 studies of  land-use change in the tropics. They then used data on habitat preferences, migratory status, diet, generation length and body size to determine how differences in these traits related to birds’ response to land-use change.

They found that long-lived, non-migratory, primarily frugiverous or insectivorous forest specialists were likely to be less abundant and less likely to occur in intensively used habitats.

Probabilities of presence and abundance relative to primary forest based on dietary preferences of tropical bird species

Of these characteristics diet preference is perhaps the most easy to link to changes in ecosystem function and services.

The loss of insect eating species may impact the control of pest species with potentially negative consequences for tropical agriculture. However, this assumption depends heavily on pest species abundances not reducing in line with bird declines. It is also entirely possible that if pest species also reduce in abundance forest loss will lead to little change in crop damage.

The reduction in fruit eating bird species may have consequences for forest regeneration and maintainance of plant diversity. Many secondary forests that are isolated from primary forest have been shown to lack large seeded tree species. Any reduction in the abundance of fruit eating birds suggests another barrier preventing the recovery of plant species communities in secondary forests.

I really liked this paper. It shows the value of large datasets for making generalisations and the results are potentially important for investigating change in ecosystem function and services in tropical forest ecosystems. The good news is it looks like there is a lot more of this type of work on the way with the PREDICTS project aiming to do take a similar approach to many questions related to land-use change. I’m excited to see what they come up with next, provided they don’t scoop me in the process…